Religiosity Infographic
Challenge:
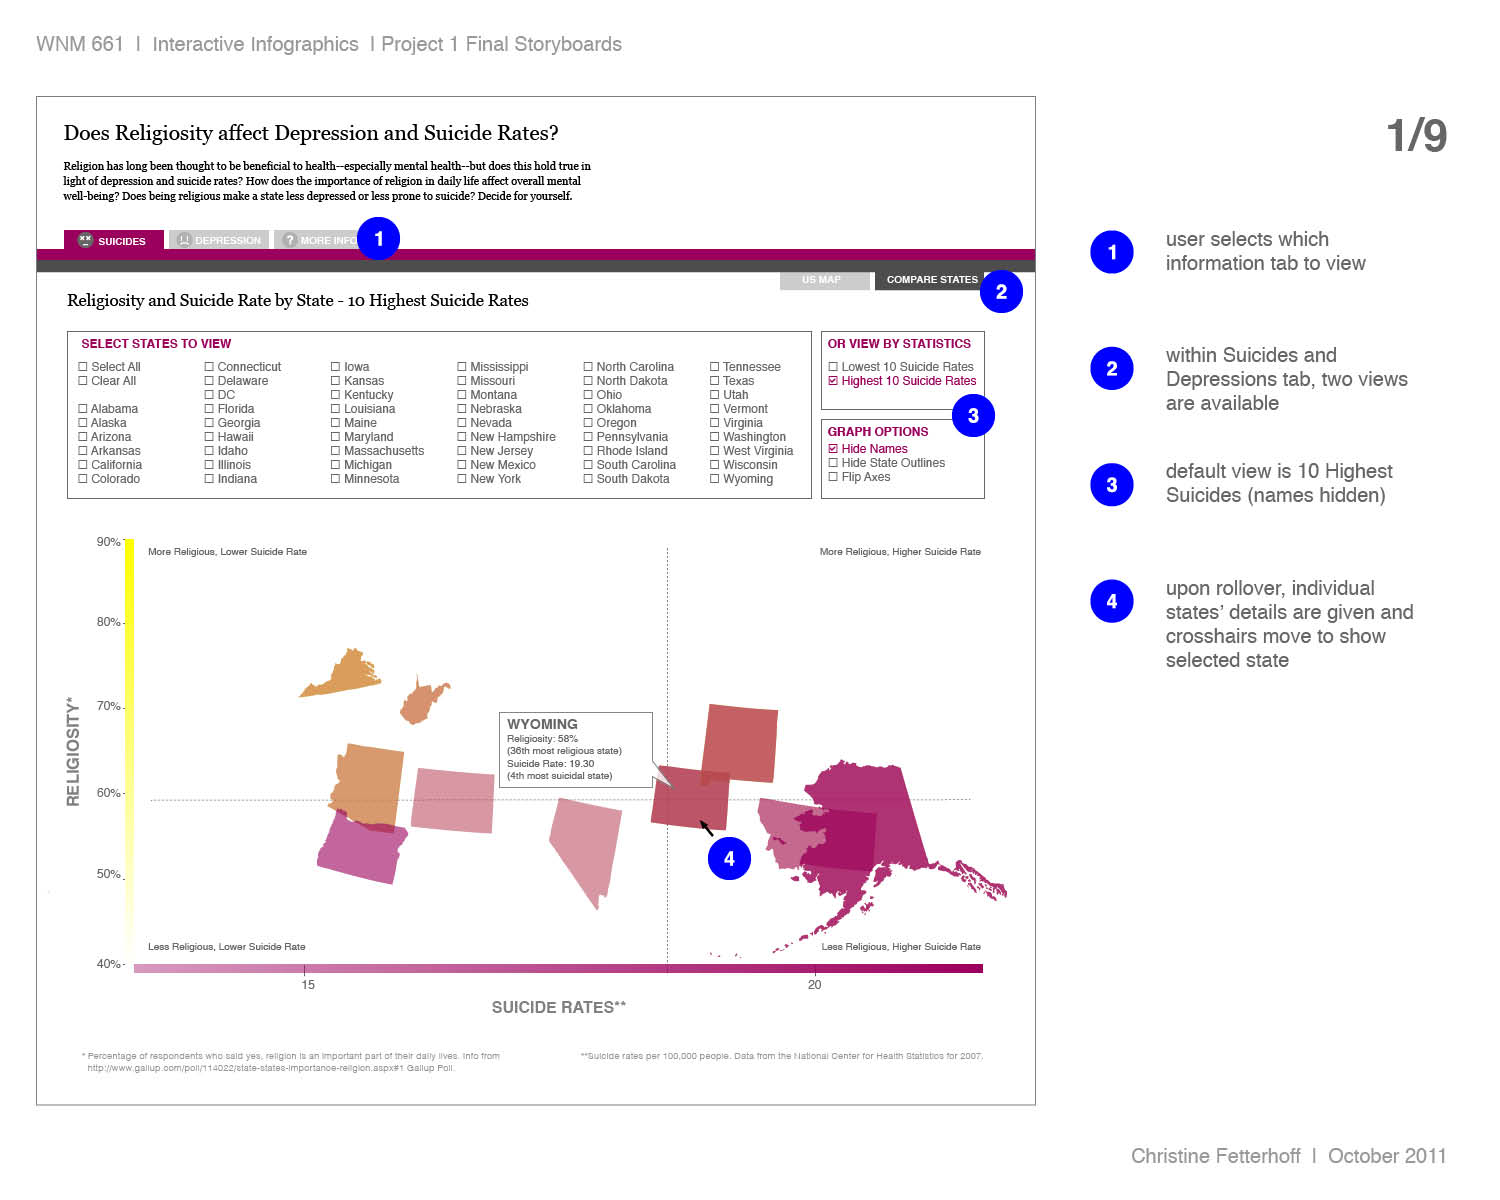
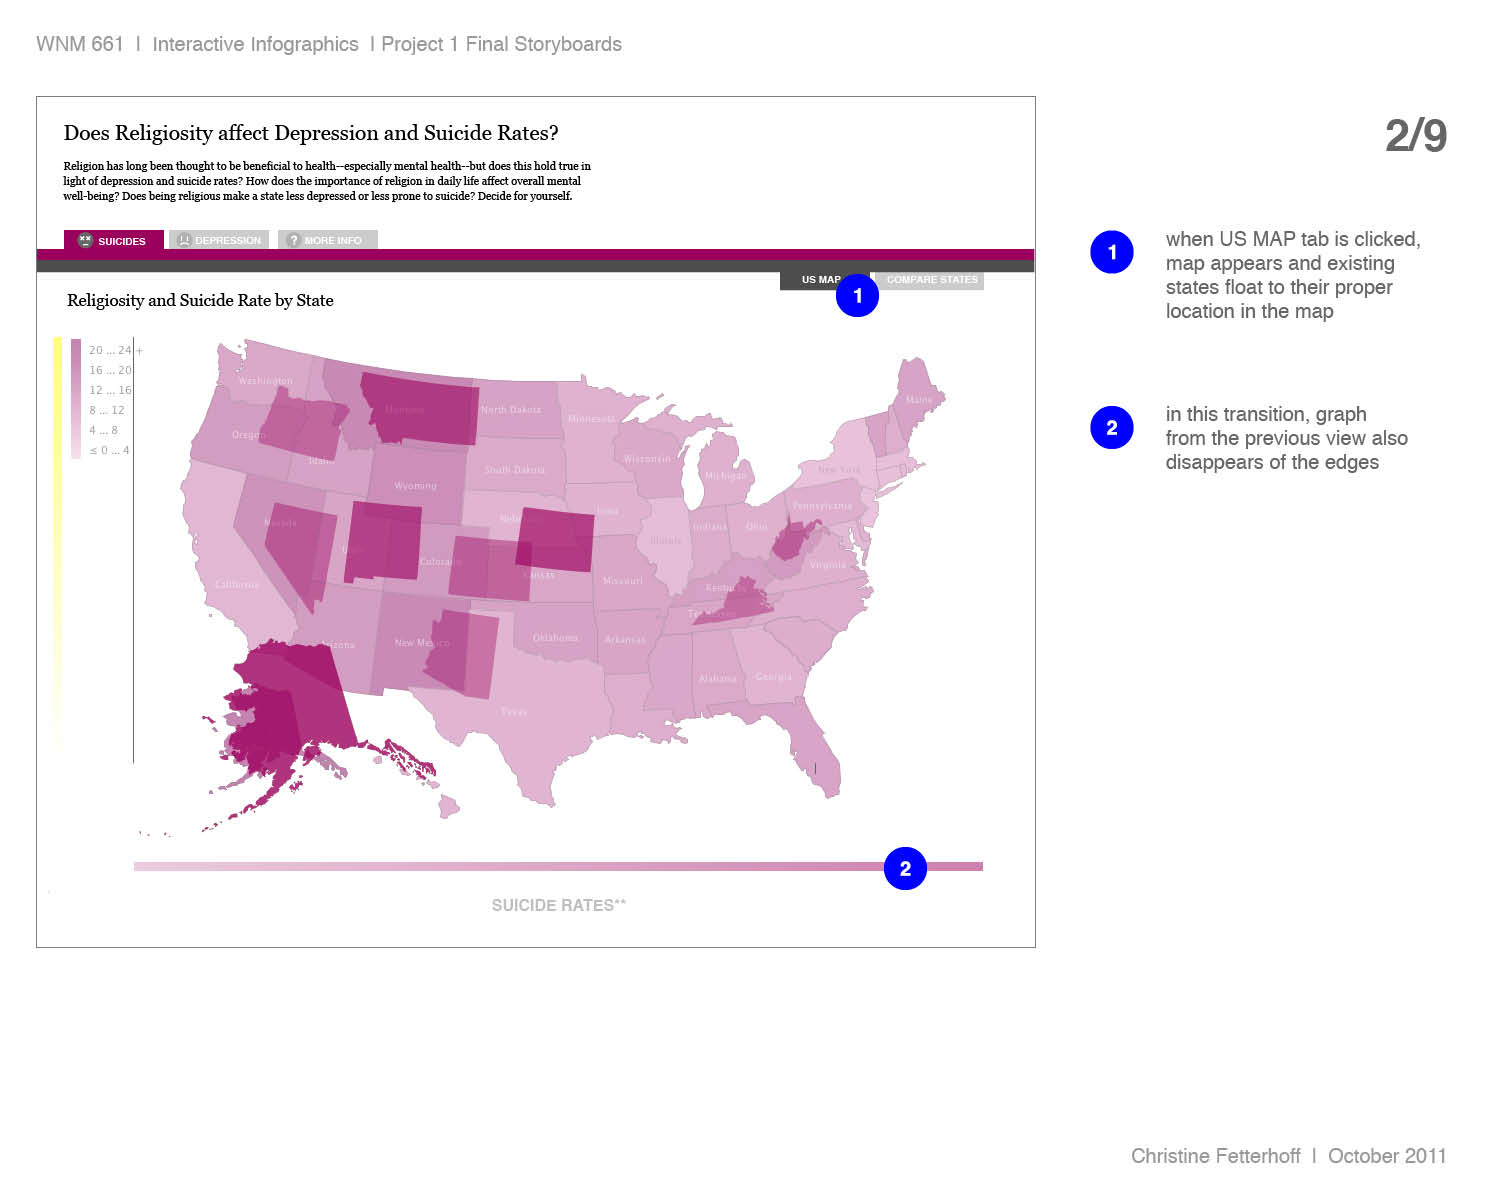
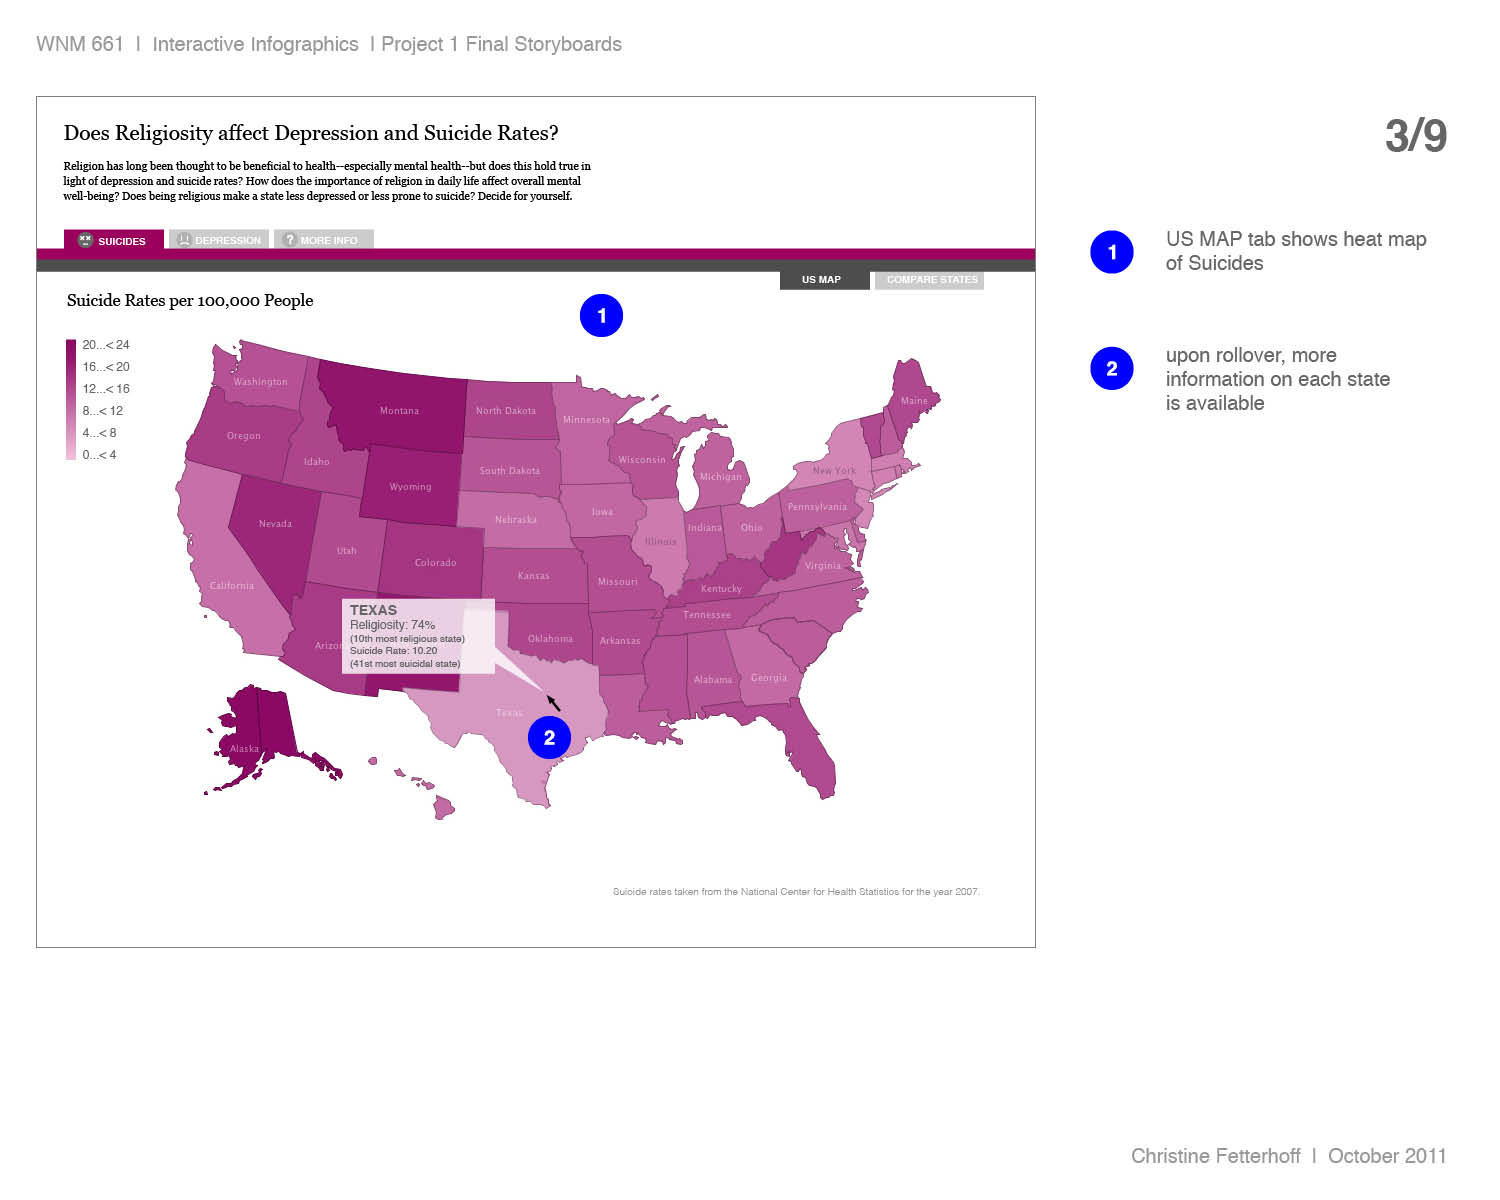
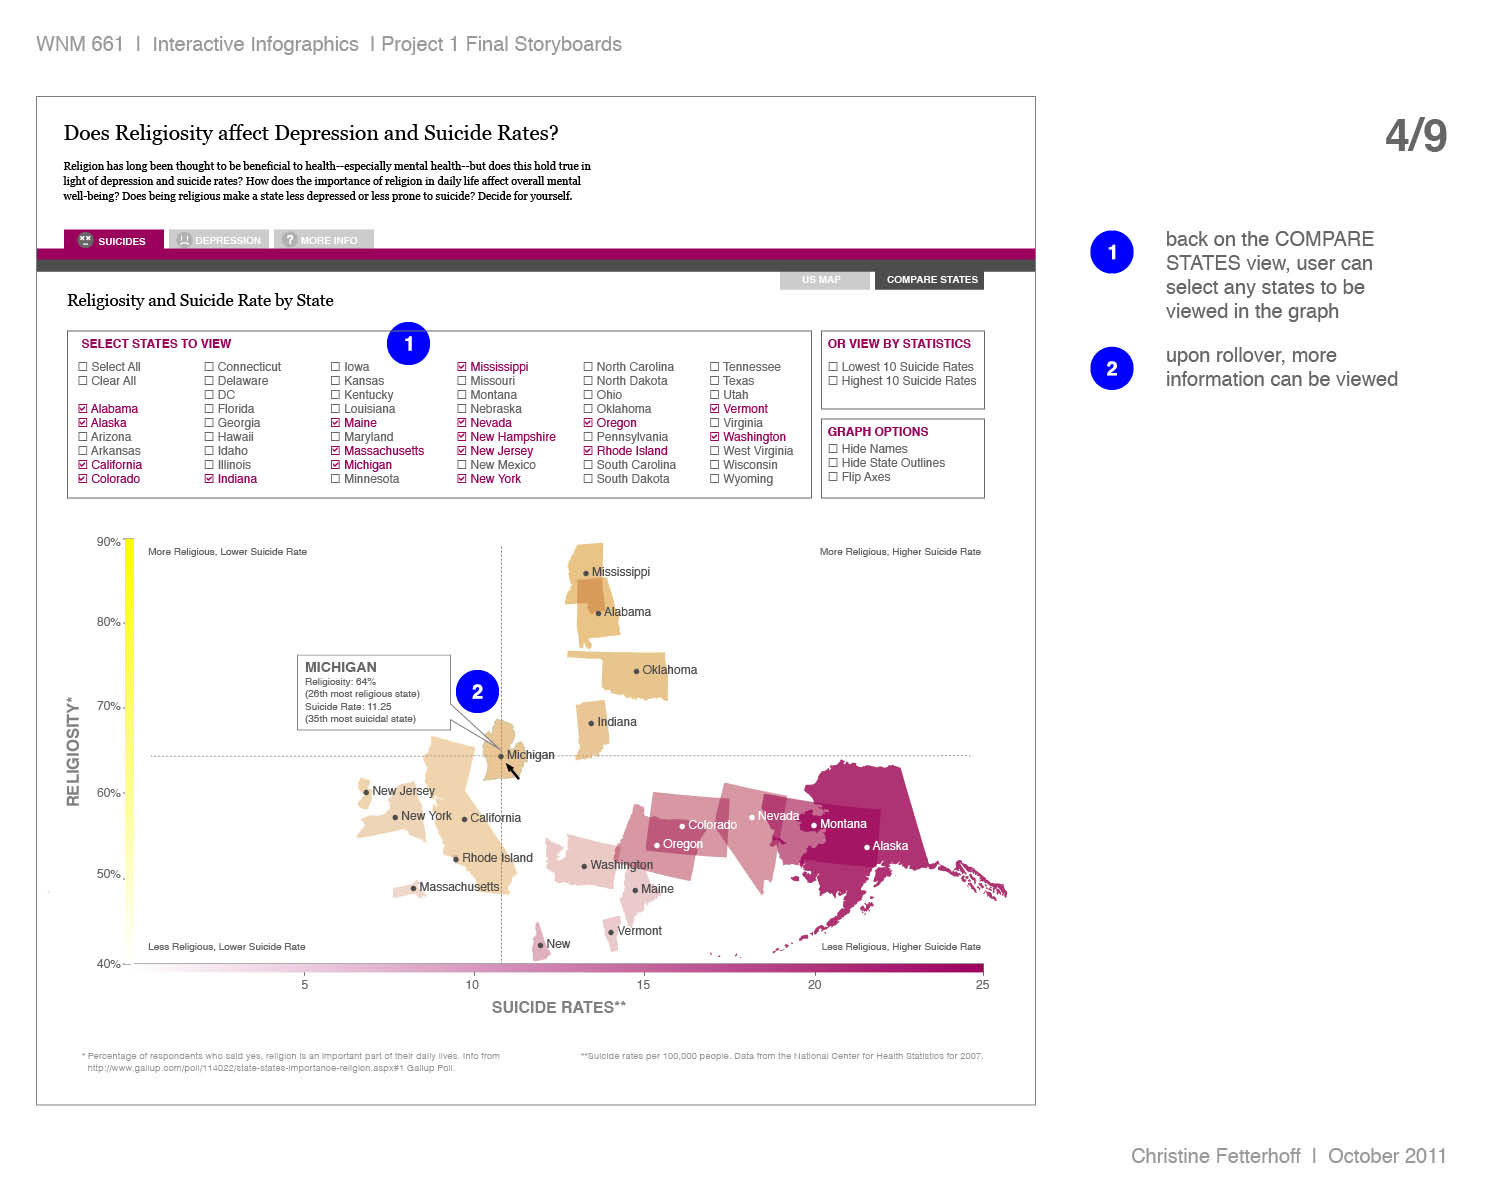
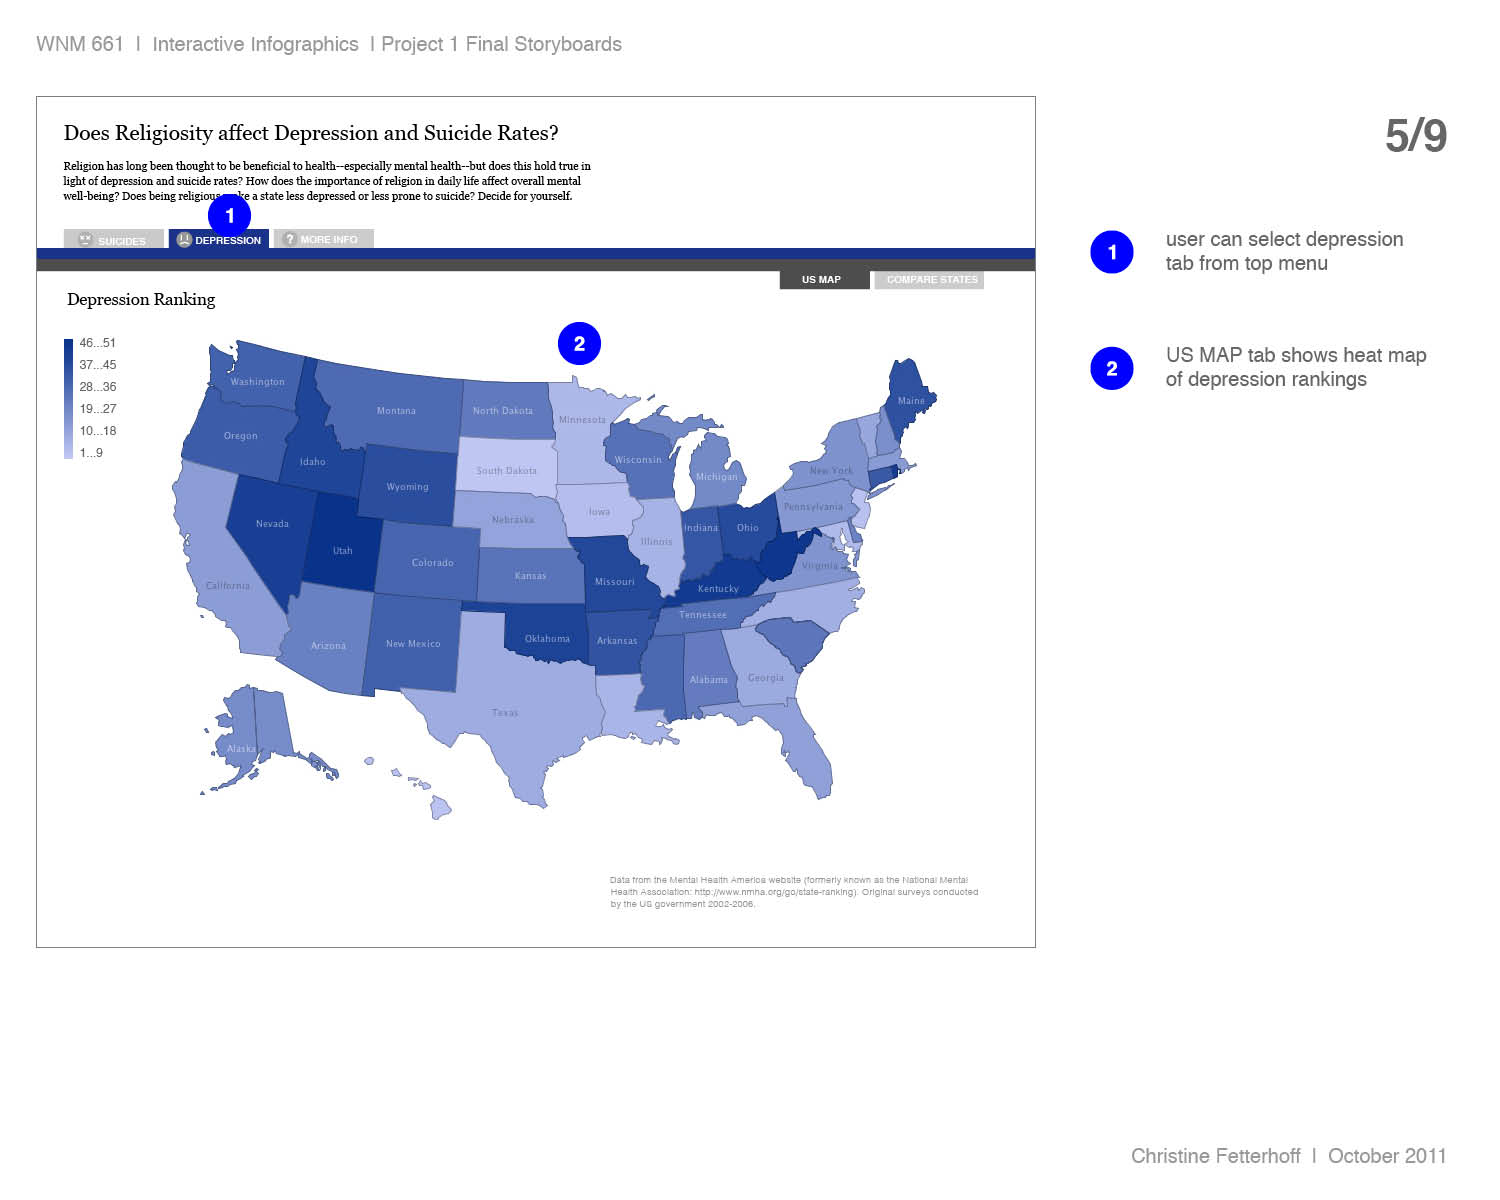
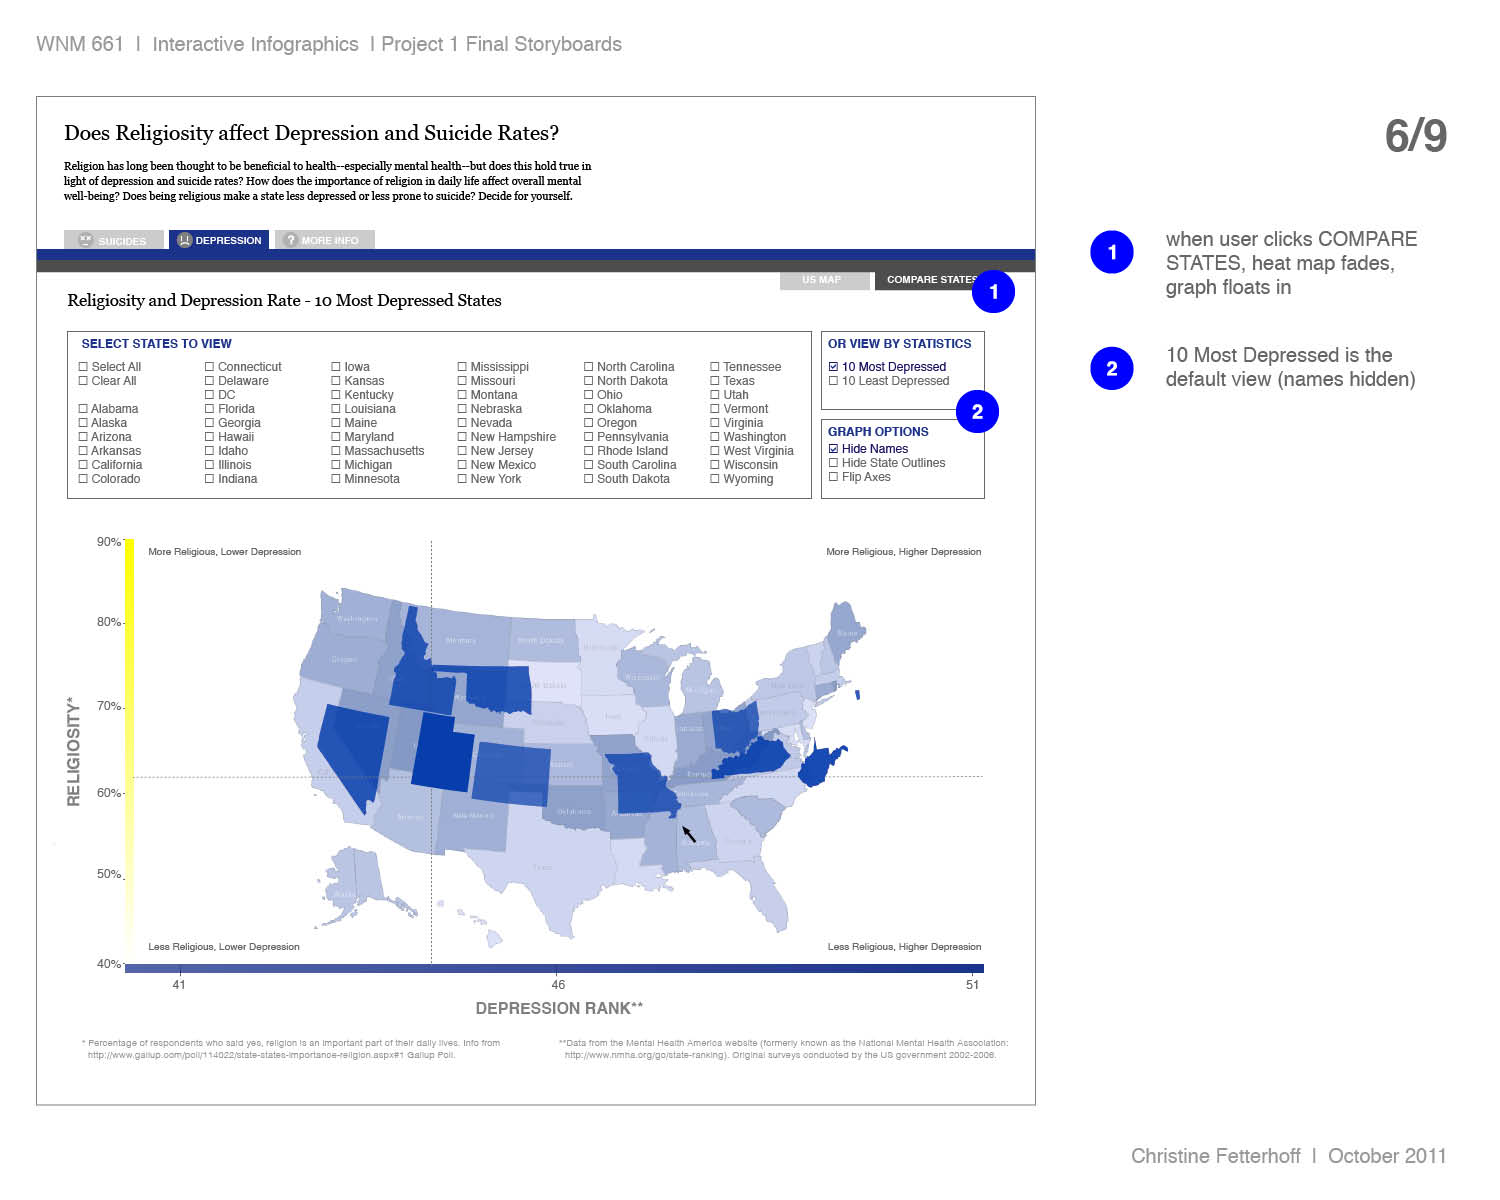
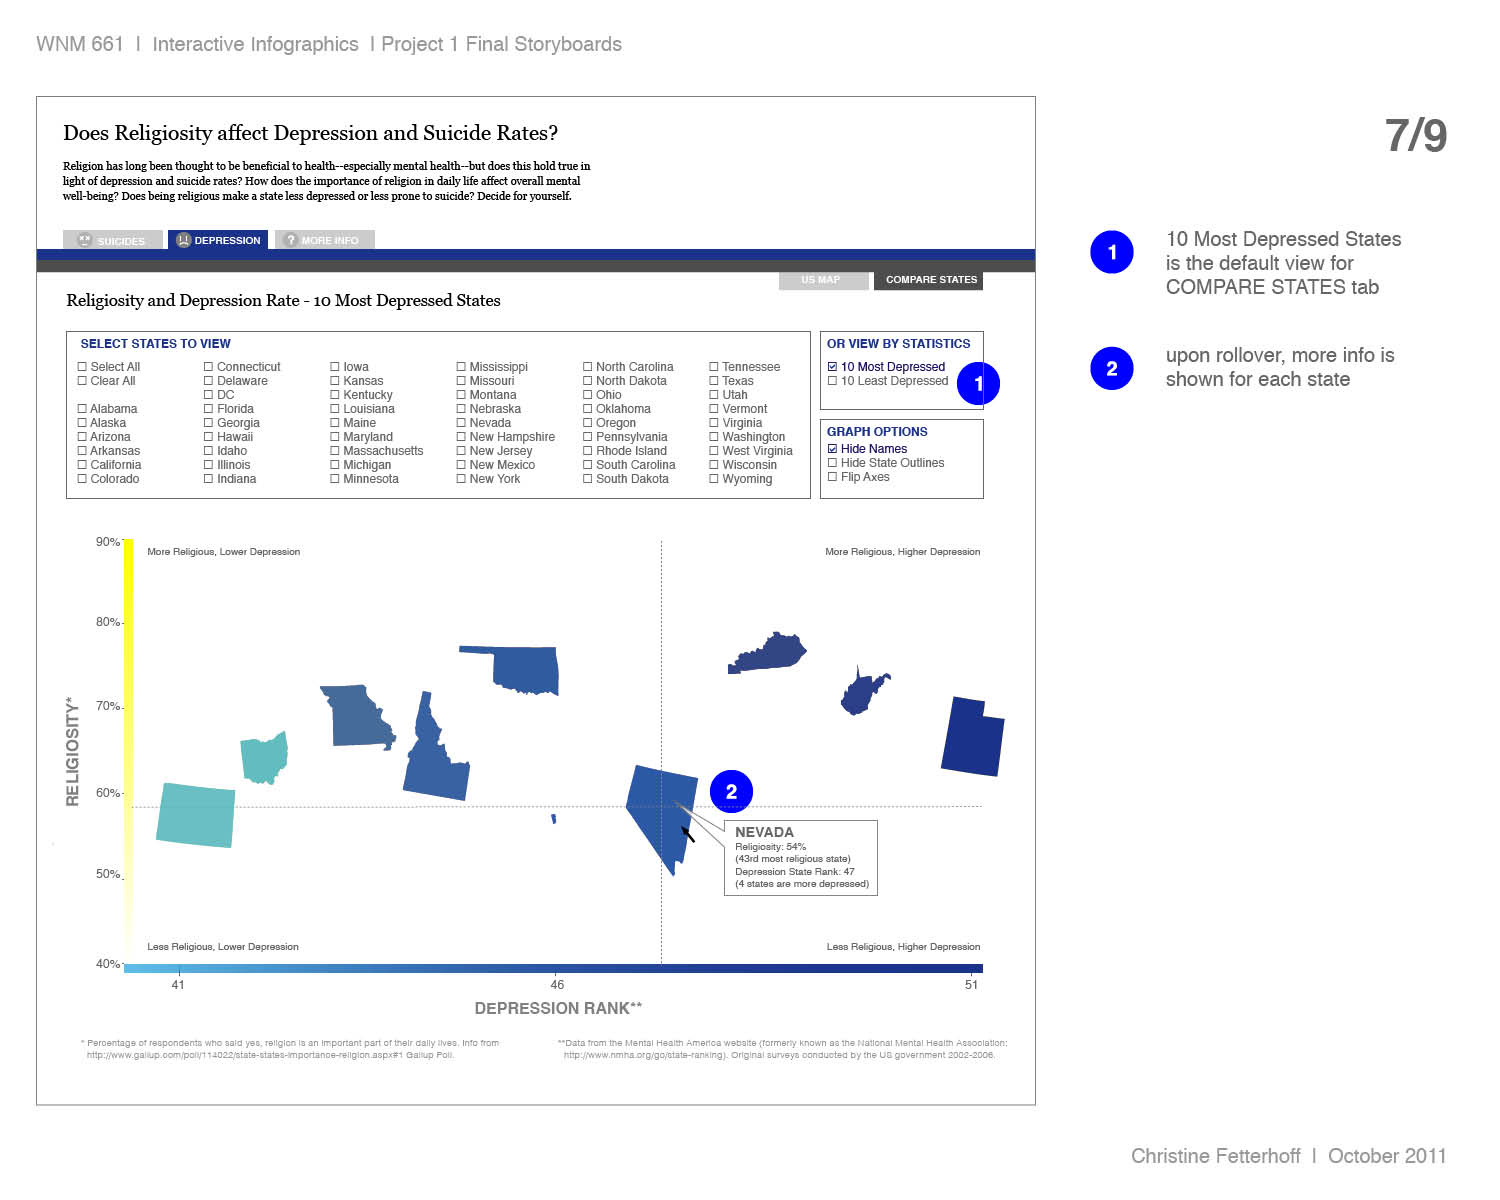
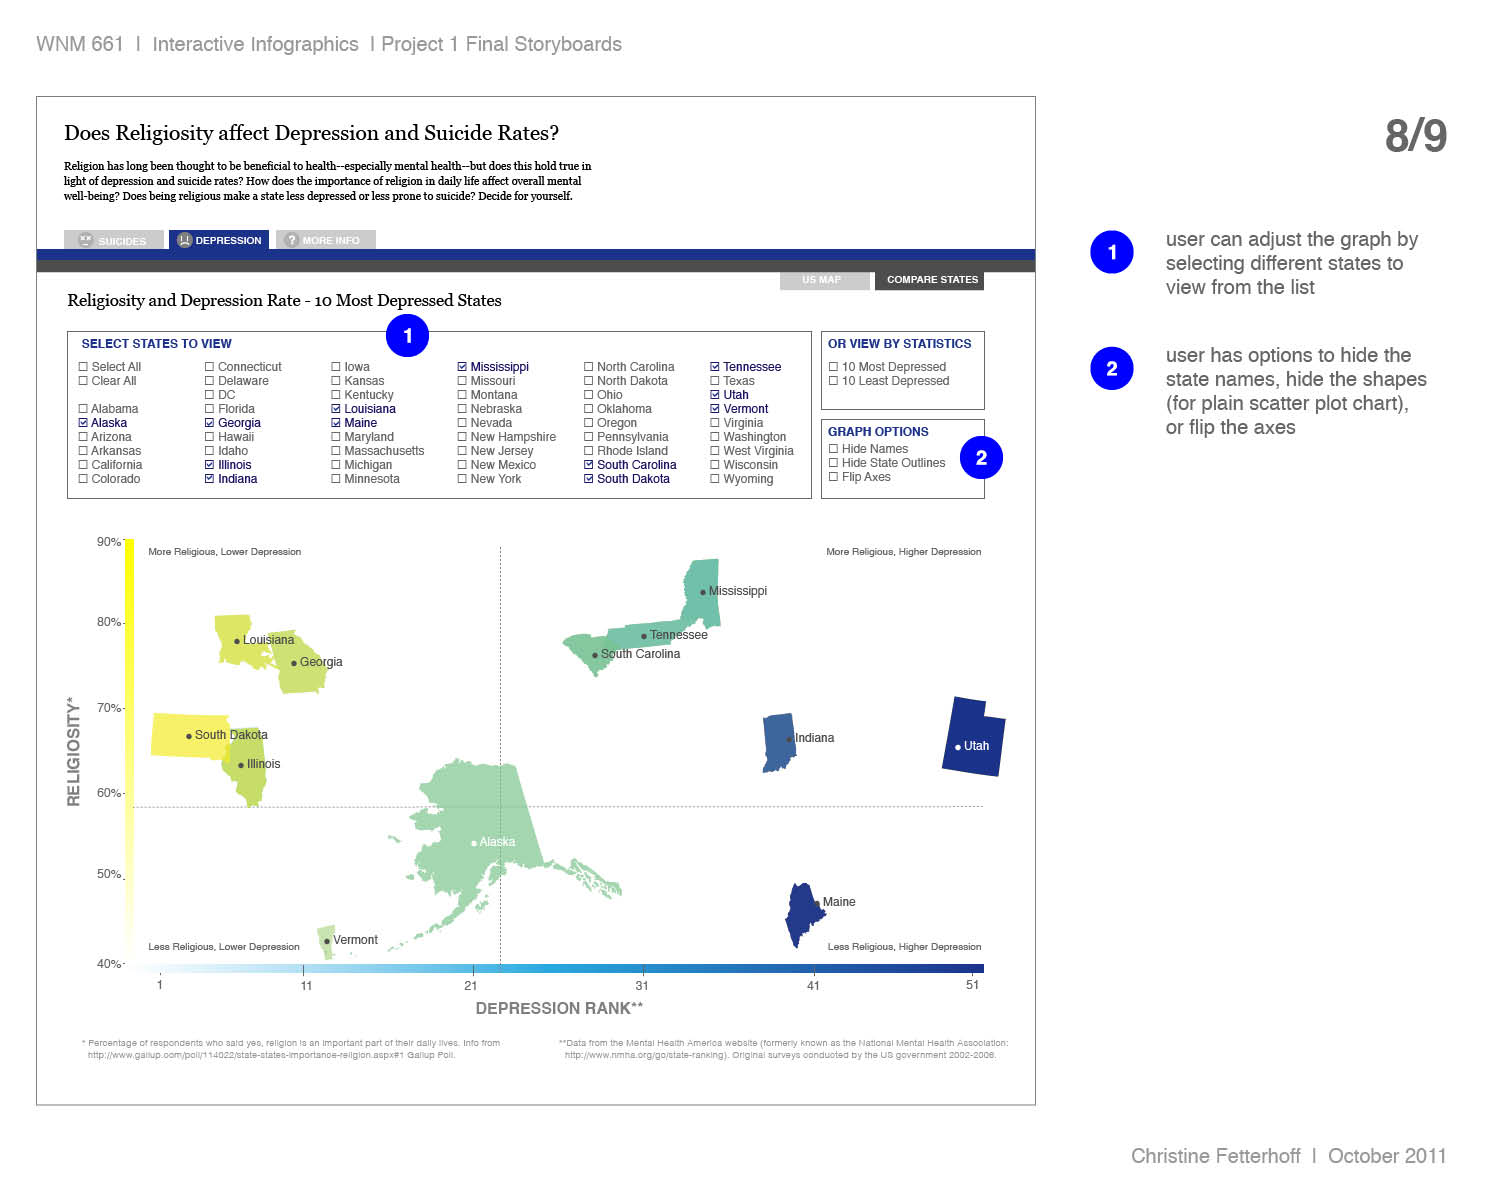
Take a large amount of quantitative data and make it understandable, focusing on interaction and storytelling. Brand it according to the New York Times (nytimes.com).
Solution:
An interactive concept that takes three large datasets and compares them in a visually stunning manner.
My Role:
Concept, data research, design, storyboards.
Awarded 1st Place in the 2012 Web Design + New Media Spring Show, Interactive Infographics Category


